































Logo
100% Job Interview Guarantee

Best Data Analytics Course in Mumbai with Gen AI

Want to make a career in Data Analytics? Then, Join The NexaLearn Data Analytics Course in Mumbai and learn 20+ Gen AI, Real World Projects through live classes, assignments with 100% Placement Support.

Our Programs are Backed by

NSDCMinistry of Skill Development and EntrepreneurshipSkill India
Student 1Student 2Student 3Student 4

4.9/5 by 2,000+ Students

Claim Your Free Roadmap

Talk to our career experts and get a personalized learning path to your dream job.

+91

Your privacy is our priority. No spam ever.

The NexaLearn Data Analyst Course in Mumbai That Helped

4k+ students

We don't just teach. we help our students to get job in top-tier companies.

Samsung
Accenture
Deloitte
TCS
Siemens
ICICI Bank
Tech Mahindra
Infosys
Samsung
Accenture
Deloitte
TCS
Siemens
ICICI Bank
Tech Mahindra
Infosys
Microsoft
Flipkart
Myntra
Zepto
Cred
Blinkit
Zomato
Swiggy
EY
PwC
boAt
Microsoft
Flipkart
Myntra
Zepto
Cred
Blinkit
Zomato
Swiggy
EY
PwC
boAt

100% Placement Support

200+ ACTIVE OPENINGS

After completation of our course, our placement team helps you to land your first high-paying jobs.

Learn more

Average Hike

85%

Google

Data Analyst

Google • Bangalore

Estimated CTC

35 LPA
HOT

Create Standout Portfolio

The NexaLearn Mumbai offers mock interview & helps to create a standout Portfolio.

Average Hike

85%

Arjun Sharma

Arjun Sharma

Business Analyst

Optimized
Portfolio Live

Resume Score

92/100

Mock Interview Preparation

Our Data Analyst Course in Mumbai gives you project work to practise these tasks, so you have something specific to discuss when questions about your skills come up.

Average Hike

85%

Interview Rating

CommunicationEXCELLENT
Technical DepthSTRONG
Problem SolvingTOP 1%

Feedback from Industry Expert

Meta

Become A Certified

Data Analyst

Become a certified Data Analyt with The NexaLearn Data Analytics Course in Mumbai and land your first high-paying job.

12.6 LPA
HIGHEST SALARY
200 +
PARTNER COMPANIES
100%
JOB ASSISTANCE
5.7 LPA
AVERAGE SALARY
NexaLearn
Standard Courses
Industry Readiness

6–10 month job-focused curriculum.

Long programs with less practical exposure.

Personalised Placement Support

200+ hiring partners with placement support.

Limited support and generic job portals.

Classroom Learning

300+ hours of live online & offline sessions.

Mostly self-paced with fewer live classes.

Data Analytics Studio

Studio projects, hackathons, and masterclasses.

Limited real-world project exposure.

Personalised Mentorship

1:1 mentorship from industry experts.

Limited personalised career guidance.

Book A Free Demo

Looking for a stable career? Join Our Free Demo and enroll our best data analytics course in Mumbai.

AI-Infused Data Analytics Curriculum in Mumbai

Our Job-Guarantee Data Analytics Course in Mumbai follows AI-Infused Structure which helps you to use earn how to use 20+ Gen AI tools for tasks such as finding information, working through documents and preparing reports.

Module 01

Business Analytics Foundations

Teach learners how data analytics is used to solve real business problems, not just how to operate tools.

Key Topics

What is data analytics?
Types of analytics
•

Descriptive analytics

•

Diagnostic analytics

•

Predictive analytics

•

Prescriptive analytics

Difference between data, metrics, KPIs, and insights
Business questions vs data questions
Understanding stakeholders and requirement gathering
Defining success metrics
Common business metrics
•

Revenue

•

Profit margin

•

Conversion rate

•

Retention rate

•

Churn rate

•

Customer lifetime value

•

Average order value

•

Return on ad spend

Basics of data storytelling and communicating insights to non-technical stakeholders
Practical Capstone Project

Business Problem Framing Project

Convert a vague problem such as “Sales are declining. Find out why.” into business questions, required data, KPIs, an analysis plan, and an expected dashboard/report structure.

Module 01

Business Analytics Foundations

Teach learners how data analytics is used to solve real business problems, not just how to operate tools.

Key Topics

What is data analytics?

Types of analytics

•

Descriptive analytics

•

Diagnostic analytics

•

Predictive analytics

•

Prescriptive analytics

Difference between data, metrics, KPIs, and insights

Business questions vs data questions

Understanding stakeholders and requirement gathering

Defining success metrics

Common business metrics

•

Revenue

•

Profit margin

•

Conversion rate

•

Retention rate

•

Churn rate

•

Customer lifetime value

•

Average order value

•

Return on ad spend

Basics of data storytelling and communicating insights to non-technical stakeholders

Practical Capstone Project

Business Problem Framing Project

Convert a vague problem such as “Sales are declining. Find out why.” into business questions, required data, KPIs, an analysis plan, and an expected dashboard/report structure.

Module 02

Modern Excel for Business Analytics

Teach Excel as a practical business analytics tool, including modern functions, Power Query, reporting, and dashboarding.

Key Topics

Excel basics

•

Interface, cell formatting, data types, sorting, filtering, data validation, named ranges, and conditional formatting

Modern Excel functions

•

SUM, COUNT, MIN, MAX, AVERAGE, COUNTA, COUNTBLANK

•

IF, AND, OR, NOT

•

SUMIF, SUMIFS, COUNTIF, COUNTIFS

•

XLOOKUP, INDEX, MATCH

•

FILTER, SORT, UNIQUE

•

LEFT, RIGHT, MID, FIND, LEN, TRIM, SUBSTITUTE, UPPER, LOWER, PROPER

•

TODAY, NOW, MONTH, YEAR, DAY, WEEKDAY, NETWORKDAYS, WEEKNUM

Data cleaning in Excel

•

Removing duplicates, handling blanks, standardizing text, splitting and combining columns, cleaning dates, and preparing sales/customer data

Pivot tables and reporting

•

Grouping, binning, calculated fields, slicers, timelines, summary reports, and cross-tab reports

Power Query

•

Importing from Excel/CSV/folders, removing and renaming columns, changing data types, merging, appending, and creating reusable cleaning workflows

Excel dashboards

•

Dashboard design, KPI cards, trend charts, bar charts, waterfall charts, dynamic dashboards, and executive layouts

Practical Capstone Project

Retail Sales Excel Dashboard

Clean raw sales data and build a dashboard showing total sales, monthly trend, top products, top regions, profit margin, customer segments, and salesperson performance.

Module 03

SQL for Real-World Analytics

Teach SQL as the core skill for analysis, reporting, segmentation, cohorting, and business decision-making.

Key Topics

SQL foundations

•

Relational databases, tables, primary keys, foreign keys, data types, SELECT, WHERE, ORDER BY, GROUP BY, HAVING, DISTINCT, and NULL handling

Joins and data merging

•

INNER JOIN, LEFT JOIN, RIGHT JOIN, FULL OUTER JOIN, UNION, UNION ALL, INTERSECT, and EXCEPT

Business SQL

•

CASE WHEN, date functions, text functions, conditional aggregations, deduplication, rollups, and revenue calculations

Intermediate SQL

•

Subqueries, CTEs, temporary tables, window functions, ROW_NUMBER, RANK, DENSE_RANK, LAG, LEAD, running totals, and moving averages

Advanced analytics SQL

•

Cohort analysis, funnel analysis, retention analysis, segmentation, churn-risk identification, RFM analysis, booking window analysis, attribution basics, data quality checks, and query optimization basics

Cloud SQL exposure

•

Google BigQuery, Snowflake, Microsoft Fabric Warehouse, Amazon Redshift, or Databricks SQL

Practical Capstone Project

Customer Retention SQL Project

Calculate first purchase date, last purchase date, total orders, total revenue, average order value, repeat customer flag, churn-risk flag, monthly retention, and cohort performance.

Module 04

Data Modeling and Analytics Engineering

Teach learners how trusted analytics datasets are designed before dashboards are built.

Key Topics

Data modeling basics

•

Transactional vs analytical data, OLTP vs OLAP, fact tables, dimension tables, star schema, snowflake schema, table grain, primary keys, and foreign keys

Analytics engineering workflow

•

Raw layer, staging layer, intermediate layer, mart layer, metric layer, documentation, testing, and data lineage

Practical data models

•

Customer dimension, product dimension, date dimension, sales fact table, marketing campaign fact table, web events fact table, and aggregated reporting tables

Data quality

•

Null checks, duplicate checks, referential integrity, freshness checks, volume checks, outlier checks, and metric reconciliation

Version control basics

•

Why Git matters, GitHub basics, project folder structure, SQL file organization, and README documentation

Practical Capstone Project

Build an Analytics Data Mart

Convert raw orders, customers, and products into staging tables, intermediate models, and business marts such as mart_customer_revenue and mart_monthly_sales.

Module 05

Power BI for Enterprise Analytics

Teach Power BI as an enterprise BI and decision-support platform, not just a desktop visualization tool.

Key Topics

Power BI foundations

•

Power BI Desktop, Power BI Service, import mode, DirectQuery, data view, model view, and report view

Power Query

•

Cleaning data, merging, appending, conditional columns, type changes, date transformations, text transformations, and parameterized queries

Data modeling in Power BI

•

Star schema, fact/dimension tables, relationships, cardinality, filter direction, date tables, role-playing dimensions, and measure tables

DAX

•

Calculated columns vs measures, SUM, COUNT, DISTINCTCOUNT, CALCULATE, FILTER, ALL, DIVIDE, time intelligence, YTD, MTD, QTD, rolling averages, ranking, contribution percentage, row context, and filter context

Dashboard and report design

•

KPI cards, trend charts, bar charts, matrix visuals, drill-through pages, tooltips, bookmarks, field parameters, slicers, filters, and executive summary pages

Enterprise Power BI

•

Publishing, workspaces, scheduled refresh, gateway basics, row-level security, app sharing, deployment pipelines, Performance Analyzer, and dataset optimization

AI-ready Power BI

•

Clean semantic model design, business-friendly field names, measure descriptions, and consistent metric definitions

Practical Capstone Project

Executive Sales Performance Dashboard

Build and publish a dashboard showing revenue, profit, monthly growth, region performance, product category performance, salesperson ranking, customer segments, and drill-through details.

Module 06

Tableau for Data Storytelling

Teach Tableau as a visual storytelling and exploratory dashboarding tool.

Key Topics

Tableau foundations

•

Interface, data connections, dimensions and measures, discrete vs continuous fields, marks card, shelves, filters, and parameters

Tableau calculations

•

Calculated fields, logical calculations, string calculations, date calculations, table calculations, percent of total, running total, rank, and Level of Detail expressions

Visual analytics

•

Bar charts, line charts, scatter plots, heatmaps, maps, dual-axis charts, combo charts, reference lines, trend lines, and forecasting basics

Dashboard design

•

Layouts, containers, actions, filters, parameters, story points, executive storytelling, and avoiding dashboard clutter

Practical Capstone Project

Customer Segmentation Dashboard

Build a dashboard showing customer segments, revenue by segment, retention by segment, region-wise distribution, high-value customers, and churn-risk customers.

Module 07

Python for Data Analytics

Teach Python as a practical tool for data cleaning, analysis, automation, and machine learning.

Key Topics

Python foundations

•

Installation, Jupyter Notebook, VS Code, variables, data types, strings, lists, tuples, dictionaries, sets, conditionals, loops, functions, lambda functions, comprehensions, error handling, files, modules, and packages

Python for data work

•

Virtual environments, package installation, project folder structure, reading CSV/Excel/JSON files, connecting to APIs, and writing reusable scripts

NumPy

•

Arrays, indexing, slicing, reshaping, combining arrays, math operations, and basic statistics

pandas

•

Series, DataFrames, reading data, inspecting data, filtering rows, selecting columns, renaming, dropping, missing values, duplicates, type conversion, dates, grouping, merging, appending, pivots, and derived columns

Exploratory data analysis

•

Summary statistics, frequency tables, univariate analysis, bivariate analysis, correlation, outliers, missing values, and business interpretation

Data visualization

•

Matplotlib, Seaborn, line charts, bar charts, histograms, box plots, scatter plots, heatmaps, regression plots, and geospatial basics with Folium

Python automation

•

Automating repeated reports, cleaning multiple files from a folder, exporting clean datasets, creating automated Excel outputs, and report automation concepts

Practical Capstone Project

Marketing Campaign Analysis with Python

Clean campaign data and calculate impressions, clicks, CTR, spend, CPC, conversions, CPA, revenue, ROAS, best-performing campaign, and worst-performing campaign.

Module 08

Statistics for Data Analysts

Teach statistical thinking required for reliable business decision-making.

Key Topics

Foundations

•

Population vs sample, mean, median, mode, variance, standard deviation, percentiles, distributions, skewness, and outliers

Probability basics

•

Probability concepts, conditional probability, expected value, normal distribution, and binomial distribution

Inferential statistics

•

Sampling, sampling bias, confidence intervals, hypothesis testing, p-values, statistical significance, and practical significance

Business testing

•

A/B testing, control vs treatment, conversion rate testing, t-test, chi-square test, ANOVA basics, sample size intuition, experiment design, and common testing mistakes

Regression interpretation

•

Simple linear regression, multiple linear regression, coefficients, R-squared, residuals, and correlation vs causation

Practical Capstone Project

A/B Testing Project

Analyze two versions of a landing page and decide which performed better, whether the difference is statistically meaningful, and whether the business should roll out the new version.

Module 09

Applied Machine Learning for Analysts (Data Science)

Teach machine learning as a practical business analytics skill, not as abstract theory.

Key Topics

ML foundations

•

Supervised learning, unsupervised learning, regression, classification, clustering, train/test split, features, and target variables

Regression models

•

Linear regression, decision tree regression, random forest regression, RMSE, MSE, MAE, and business interpretation of errors

Classification models

•

Logistic regression, decision tree classifier, random forest classifier, KNN, accuracy, precision, recall, F1-score, confusion matrix, and ROC-AUC basics

Model improvement

•

Feature engineering, categorical variables, scaling, cross-validation, grid search, overfitting, and underfitting

Unsupervised learning

•

K-means clustering, PCA, customer segmentation, and cluster interpretation

Deployment basics

•

Saving models with pickle, simple Streamlit apps, model documentation, and business recommendations from model outputs

Responsible ML

•

Bias in data, explainability, model limitations, human review, and monitoring model performance

Practical Capstone Project

Customer Churn Prediction

Build a model to predict customers likely to churn, compare models, evaluate performance, explain model limitations, and recommend business actions.

Module 10

Generative AI for Data Analytics

Teach learners how to use GenAI responsibly and practically in analytics workflows.

Key Topics

GenAI foundations

•

LLMs, GPT-style models, tokens, context windows, prompt engineering, system prompts, user prompts, few-shot prompting, hallucination risk, and bias risk

AI-assisted analytics

•

Using AI to understand business problems, generate SQL drafts, debug SQL, explain SQL, write Python, debug Python, summarize EDA, design dashboards, and generate stakeholder summaries

OpenAI API and LLM workflows

•

API basics, API keys conceptually, request/response structure, temperature, max tokens, cost awareness, prompt templates, and structured outputs

Embeddings and vector search

•

Embeddings, semantic search, FAISS, vector databases, similarity search, and analytics use cases

RAG for analytics

•

Retrieval-Augmented Generation, chunking, metadata, retrieval quality, grounded answers, source citations, RAG evaluation, and preventing unsupported answers

AI agents for analytics

•

Tool use, planning, SQL agents, dashboard assistants, documentation assistants, data quality assistants, risks of agentic workflows, and human-in-the-loop review

Responsible AI

•

Data privacy, sensitive data handling, hallucination checks, governance, explainability, and when not to use AI

Practical Capstone Project

AI Analytics Assistant

Build a simple assistant that answers questions from business documents, data dictionaries, dashboard documentation, and sample datasets while retrieving relevant context and refusing unsupported answers.

Module 11

Cloud Data Platforms and Modern Data Stack

Expose learners to how analytics is delivered in modern companies using cloud platforms.

Key Topics

Modern platform concepts

•

Data warehouse, data lake, lakehouse, data mart, batch processing, streaming basics, ELT vs ETL, and bronze/silver/gold layers

Cloud warehouse exposure

•

Google BigQuery, Snowflake, Microsoft Fabric, Databricks, or Amazon Redshift

Data ingestion

•

Loading CSV files, Excel files, API data, scheduled refresh, and data pipeline basics

Data transformation

•

SQL transformations, Python transformations, Power Query transformations, and dbt-style transformation logic

Governance and cost awareness

•

Access control, data privacy, query cost, storage cost, refresh frequency, documentation, and lineage

Practical Capstone Project

Cloud Analytics Pipeline

Build a mini pipeline from raw CSV/API data to a cloud warehouse table, cleaned SQL model, business data mart, and Power BI dashboard.

Module 12

Business Domain Analytics

Teach learners how analytics changes across business functions and how metrics differ by domain.

Key Topics

Marketing analytics

•

Campaign performance, CTR, CPC, CPA, ROAS, funnel conversion, attribution basics, and lead scoring

Sales analytics

•

Revenue, pipeline analysis, win rate, sales cycle, salesperson performance, and forecasting basics

Customer analytics

•

Segmentation, RFM, customer lifetime value, churn, retention, and repeat purchase rate

Product analytics

•

DAU, MAU, activation, feature adoption, retention curves, funnel drop-off, and North Star metric

Finance analytics

•

Revenue, cost, gross margin, EBITDA basics, budget vs actual, and forecasting

Operations analytics

•

Turnaround time, SLA, defect rate, inventory, process bottlenecks, and productivity metrics

Practical Capstone Project

Business Function Analytics Case Study

Choose one domain, define the business problem, identify KPIs, clean data, analyze trends, build a dashboard, and present recommendations.

Module 13

Data Storytelling and Stakeholder Communication

Teach learners how to communicate insights clearly, professionally, and actionably.

Key Topics

Insight vs observation

Executive summary writing

Structuring analysis

Pyramid principle

Before/after comparison

Root cause explanation

Recommendation writing

Dashboard narration

Presenting uncertainty

Handling stakeholder questions

Making analysis actionable

Practical Capstone Project

Executive Insight Memo

Write a one-page memo explaining what happened, why it happened, why it matters, what the business should do next, and what the limitations are.

Module 14

Capstone Portfolio

Ensure every learner completes job-ready portfolio projects that demonstrate practical analytics ability.

Key Topics

Required portfolio projects

•

SQL business analysis

•

Power BI executive dashboard

•

Python EDA project

•

Statistics or A/B testing project

•

Machine learning project

•

GenAI analytics project

Final presentation

•

Problem statement, dataset used, methodology, tools used, key findings, business recommendations, limitations, and next steps

Practical Capstone Project

Final Capstone Presentation

Present the complete analytics portfolio to demonstrate business understanding, technical execution, communication quality, and practical decision support.

Technical Stack

20+ Gen AI Tools You Will Learn

During our Data Analyst Course in Mumbai, you’ll explore 20+ Gen AI tools for research, document searches, report preparation and everyday data tasks. 

Excel
Excel
MYSQL
MYSQL
Tableau
Tableau
Python
Python
Power BI
Power BI
Pandas
Pandas
NumPy
NumPy
Scikit Learn
Scikit Learn
Jupyter
Jupyter
GitHub
GitHub

Get the Complete Tools List

Download all the tool lists that you will master throughout our NEXGEN Data Analytics Training in Mumbai

Industry-Relevant

Projects You Will Learn

E-Commerce Sales Performance
ExcelPivot TablesVLOOKUP

E-Commerce Sales Performance

Analyze retail data using Excel Pivot Tables, VLOOKUP, and professional data cleaning techniques to identify growth opportunities.

Our Alumni

See how our graduates are changing the world.

Success Story

Akreeti Sharma

Previous RoleStudent
Current RoleOperations Analyst
atFoxit
Placed ✓
Akreeti Sharma

Akreeti Sharma

• 3rd+

Operations Analyst at Foxit Software

12h •

I'm excited to share that I'm starting a new position as a Operations Analyst at Foxit Software! I'm extremely grateful to my mentors at The NexaLearn, friends, and family for their endless support throughout this journey. #DataAnalytics #FoxitSoftware #CareerGrowth #NewBeginnings #Grateful

Starting a new position
👏
34
6 comments

Why Choose The NexaLearn Data Analytics Course in Mumbai?

If you made your mind to become data analyst, then know why The NexaLearn Data Analytics Course in Mumbai is right option for you.

Learn

Learn the Advanced Gen AI Course

Start with Excel and the basics of handling data before moving into SQL, Power BI, Tableau, Python, statistics and machine learning.

4.7/5

Average Rating

Get Mentored

Get Mentored by Industry Experts

Get Mentored with Industry Expert carrying 10+ Years of Experice in Data Analytics Background  and get expert in Data Analytics.

4.9/5

Average Rating

Build

Learn 20+ Gen AI Tools

As you complete assignments and projects, you’ll have work you can add to your portfolio. This might include Excel analysis, SQL queries, dashboards and Python along with 20+ Gen AI Tools.

20+

Gen AI Tools

SQL

SQL

Live in Project

Python

Python

Tableau

Tableau

Excel

Excel

Placement

Get Our Placement Service

Enroll in our Data Analytics Course in Mumbai with Placement Support where we provide mock-interviews, Portfolio Preparation and 200+ Hiring Partners.

100%

Interview Guarantee

Get Hired

Get Hired with 200+ Companies

After the completation of our course The NexaLearn Mumbai offer 200+ companies to land your designated Job.

200+

Hiring Partners

GoogleAmazonMicrosoftMetaNetflixAdobeUberAirbnbSpotifySamsungOracleIBMGoogleAmazonMicrosoftMetaNetflixAdobeUberAirbnbSpotifySamsungOracleIBM
IBMOracleSamsungSpotifyAirbnbUberAdobeNetflixMetaMicrosoftAmazonGoogleIBMOracleSamsungSpotifyAirbnbUberAdobeNetflixMetaMicrosoftAmazonGoogle
GoogleAmazonMicrosoftMetaNetflixAdobeUberAirbnbSpotifySamsungOracleIBMGoogleAmazonMicrosoftMetaNetflixAdobeUberAirbnbSpotifySamsungOracleIBM
DATA ANALYTICS CERTIFICATION IN MUMBAI

Globally Recognized
Data Analytics Certification in Mumbai

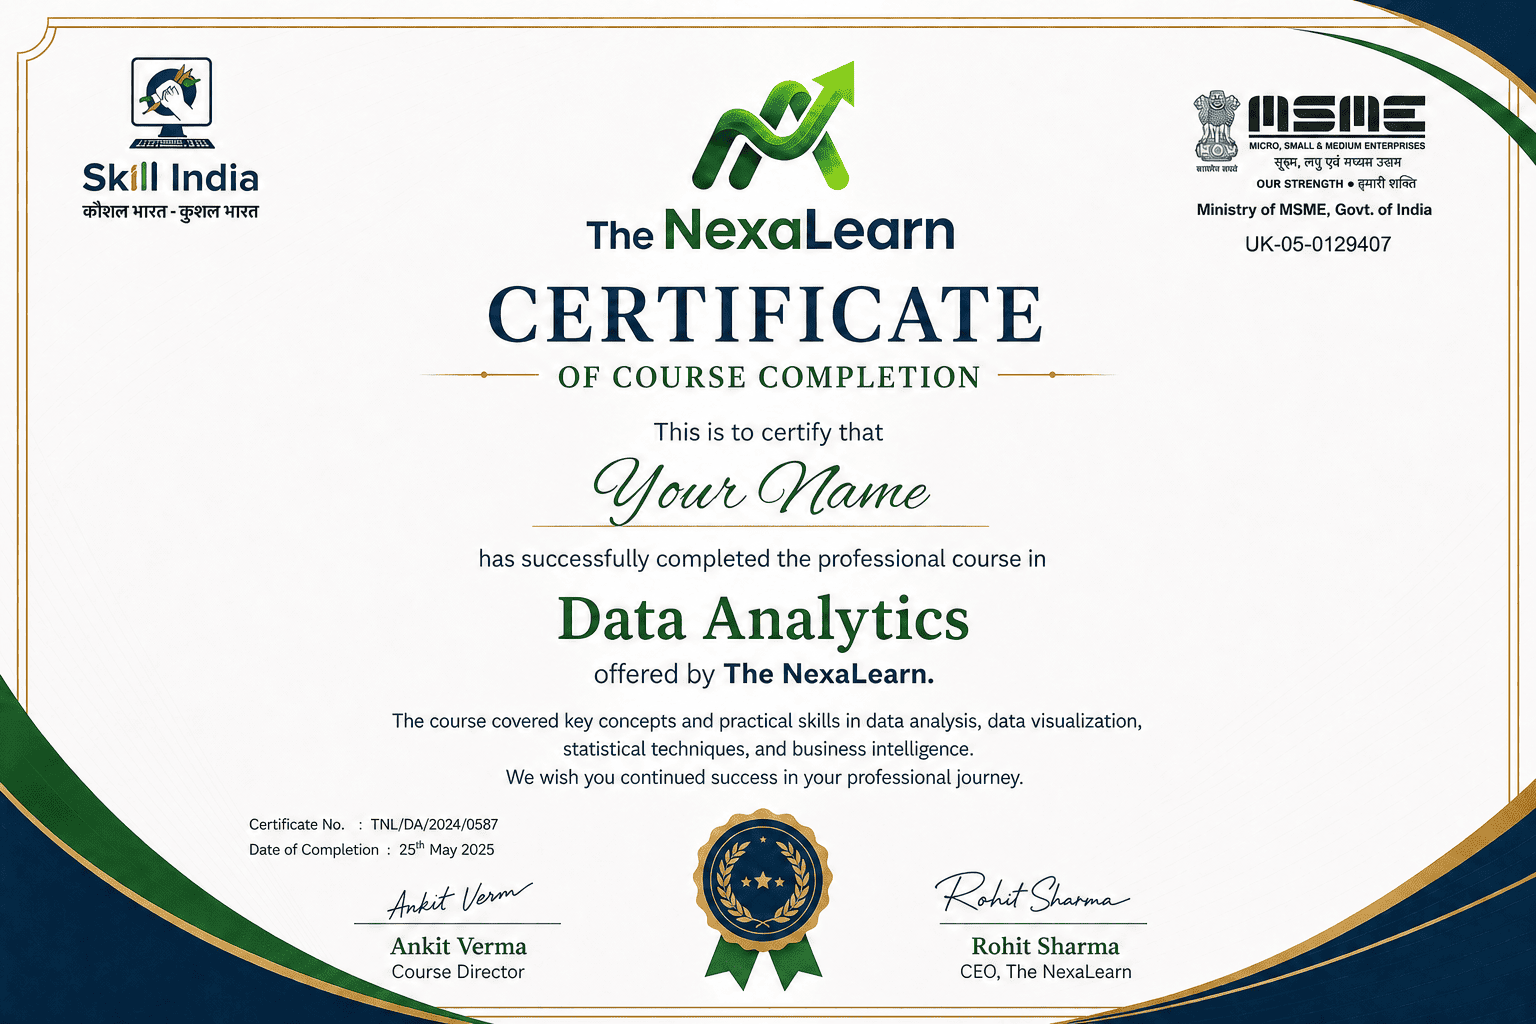
Once you finish the required classes, assignments and projects, you’ll receive your data analytics certification from The NexaLearn.

Course Completion

Course Completion

Comprehensive mastery of Data Analytics and AI.

Microsoft Certification

Microsoft Certification

Microsoft Certified Data Analyst Associate.

Google Certification

Google Certification

Google Data Analytics Professional Certificate.

Virtual Experience Programs

Virtual Experience Programs

Accenture, Infosys, KPMG, and Quantium Virtual Experience Programs.

Internship Completion

Internship Completion

Successful completion of the Data Analytics Internship.

Instant Verification

Every certificate is cryptographically signed and shareable to portfolios with a single click.

Course Completion
Full Session Review
Expert Insights

Learn from Industry Experts

Learn more about real-world data systems directly from expert professionals who are currently working on large-scale production environments and global companies.

SESSION HIGHLIGHTS+

Advanced Python & SQL Workflows: Know expert tips and tricks for missing data handling, deduplication, and anomaly detection.

Upcoming Cohorts

Flexible Batches in Mumbai

If you’re balancing college, a full-time job or other commitments, finding a suitable class timing can make a difference.  You can check both options weekend / weekdays.

Scholarships Available

Classroom Program - Data Analytics Course in Mumbai

 You can check the available batch options with our admission team and ask about weekday and weekend schedules before enrolling. This helps you choose a batch that fits around your existing routine.

Weekday

17th Nov '26'

Mon - Fri (7 PM - 9 PM)

Filling Fast
Weekend

14th Nov '26'

Sat - Sun (10 AM - 2 PM)

Open

Batch Strength

Limited to 25 Students / Batch

Free Career Guidance

Confused about the
right batch?

Talk to our academic counselors for a free 1-on-1 counseling session to evaluate your career goals.

Counselor
Counselor
Counselor

Counselors Online

Available to assist

Admissions Open

How To Join TheNexaLearn
Data Analyst Course in Mumbai?

The NexaLearn Mumbai 3-simple process to enroll in our Data Analyst Course in Mumbai

Application
Counseling
Confirm Enrollment
01

Submit Online Application

Complete the application form with your educational information, work experience, and learning interests.

15 Mins
1-on-1 Session
02

Career Counselling Session

Talk with our admissions counsellors about your objectives, clarify expectations, and ensure the program is a good fit for your career path.

03

Secure Your Seat

Fill out the required documentation and confirm your seat in the upcoming batch.

Fast-Track Entry

Next cohort starts in 12 days

Start Your Application

+91

By clicking proceed, you agree to our terms and conditions regarding the admission policy.

Investment Roadmap

The NexaLearn Data Analytics Course Fees in Mumbai

The fee covers the training, assignments, project work and career support included in the program.

Flagship Program

Data Analytics Course in Mumbai with Gen AI

Advanced Industry Readiness

₹39,900 + GST/one-time

EMI options available • No hidden charges

  • Complete Gen AI Framework
  • Live Interaction Sessions
  • Industry Tools Mastery
  • Placement Preparation
  • NexaLearn Certification
  • 1-on-1 Mentorship
Secure Payments via
Razorpay
Mastercard
UPI
Visa

Invest in Skills, Not Financial Stress

Worried that the data analytics course fee may delay your plans? Our flexible payment options can help.

Monthly Installment

₹3,565/mo
0% Interest Plan
₹15,000
Min: ₹5,000Max: ₹24,000
9 Months

Are You Eligible to Learn Data Analytics Course in Mumbai?

Career Starters

Graduates & College Students
  • Students and graduates who want to build dashboards, reports and projects that go beyond what they’ve studied in college.

  • Freshers preparing for data analyst, MIS or reporting roles who want to learn Excel, SQL, Power BI and Python.

Career Switchers

Professionals & Job Seekers
  • Professionals in sales, marketing, finance, HR or operations who regularly work with targets, customer records and performance reports.

  • People planning to move into analytics who want to add technical skills to the work experience they already have.

Leaders & Creators

Business Owners & Freelancers
  • Freelancers who want to offer clients additional services such as data analysis, reporting and dashboard creation.

  • Business owners who want to make better sense of sales figures, customer activity and business performance before deciding what to do next.

Upskilling First

In short, there is no such strict requirement to enrol in our Data Analytics Programme, as TheNexaLearn believes in upskilling.

The NexaLearn Data Analyst Course in Mumbai Overview

Everything you need to know about our AI Infused Data Analytics Course in Mumbai.

About the Program

The NexaLearn Data Analytics Course in Mumbai covers the tools you’ll need to work with data, from organising spreadsheets to building dashboards and analysing business information. You’ll learn each tool through the course and use it across assignments and projects.

6Months

Program Duration

10+

Capstone Projects

200+

Hiring Partners

2K+

Students Placed

85%

Avg. Salary Hike

Experienced by our graduates within 3 months of placement.

4.9

/5

By 2,000+ Students

Ready to Start Your Journey?

Next batch starts Nov 14th. Limited seats available.

Frequently Asked Questions

Let's answer some questions

The best institute for you depends on what you want to learn and how you plan to use those skills. At The NexaLearn Mumbai, you’ll learn Excel, SQL, Power BI, Tableau, Python, statistics and machine learning through live classes, assignments and projects. You’ll also get mentor guidance and support with interview preparation.

When comparing data analytics training providers in Mumbai, look at the syllabus, trainers, project work, class timings and career support. Check whether you’ll get to work on your own assignments and have someone review them. At The NexaLearn, Mumbai you’ll practise using analytics tools through projects and get guidance as you work through them.

If you’re working or studying during the week, weekend classes may fit your schedule better. Before enrolling, check the available timings and whether you’ll have enough time for assignments and projects. You can contact The NexaLearn team to find out which weekend batches are currently available.

The entry requirements depend on the institute and the program. If you’re new to data analytics, basic computer knowledge and a willingness to learn are useful starting points. At The NexaLearn Data Analytics Course in Mumbai, you’ll begin with Excel and move on to SQL, Power BI, Tableau, Python, statistics and machine learning as you progress through the curriculum.

Yes, the curriculum at The NexaLearn Data Analytics Course in Mumbai  includes Python and SQL, along with Excel, Power BI, Tableau, statistics and machine learning. You’ll also learn 20+ Gen AI tools and explore how they can help with research, documents, reports and everyday data tasks. For specific AI automation modules, check the latest syllabus with the admission team.

Yes, The NexaLearn provides LMS access to available course resources, including class recordings, notes, datasets and assignments. You can revisit these materials when you need to revise a topic or go back to a lesson. The exact duration of access hasn’t been confirmed here, so check the current terms with the admission team before enrolling.

Still have questions? We are here to help you guide your path to enroll our Data Analytics Course in Mumbai.

Can't Decide Which Course Is Right For You?